Executive Summary
This study presents the first multi-plant, full-scale assessment of methane (CH₄) and nitrous oxide (N₂O) emissions from 13 Swedish wastewater treatment plants (WWTPs) using advanced drone-mounted sensors. Traditional emission-factor (EF) inventories, built on limited observations and expert judgment, underestimate site-level emissions by 2.9–6.3× for CH₄ and 2.9–3.0× for N₂O. Sludge storage alone accounts for an average of 78% of CH₄ and 47% of N₂O emissions, challenging the IPCC assumption of zero N₂O release from anaerobic-digestion sludge piles. Emissions correlate strongly with sludge age, not ambient temperature above 5 °C. These findings underscore that current EF-based inventories miss over 90% of total fluxes, skew mitigation priorities, and call for widespread adoption of in situ, high-resolution monitoring to refine GHG inventories and guide effective abatement strategies.
Key Learnings
- Methane and nitrous oxide emissions at 13 WWTPs exceed IPCC Tier 1 and Sweden’s Tier 2 estimates by up to 6.3× and 3.0×, respectively.
- Sludge storage emerges as the dominant emission source for both CH₄ (78% of total) and N₂O (47% of total).
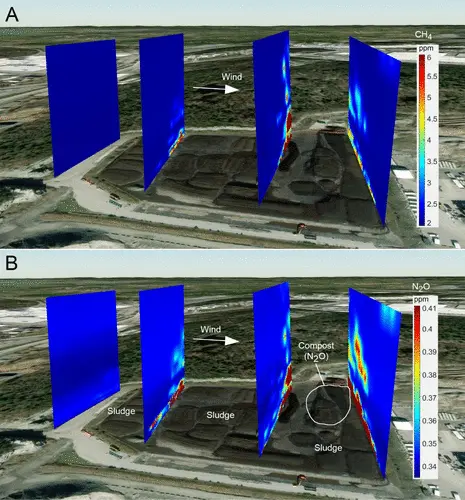
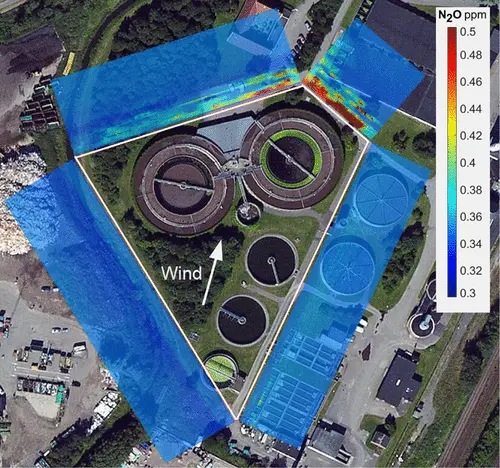
- Drone-based “virtual wall” flux mapping captures diffuse emissions missed by point-source methods, uncovering over 90% of GHGs that standard measurements overlook.
- CH₄ release scales with sludge pile age rather than air temperature above 5 °C, indicating longer high-emission periods in warming climates.
- N₂O from dewatered sludge rivals CH₄ as a CO₂e forcer and fluctuates unpredictably with pile conditions (oxygen, pH, C∕N ratio).
- Revising emission factors with real-world data is critical to drive targeted mitigation, such as thermophilic digestion, ammonia dosing, or biochar amendments.
Gålfalk M & Bastviken D. 2025. Environmental Science & Technology 59: 18146-18155. DOI: 10.1021/acs.est.5c04780
Understanding GHG Emissions in WWTPs
Worldwide, nearly half of organic waste from households and industries reaches WWTPs, creating nitrogen-rich streams prone to GHG release. Current inventories estimate 14–33 Tg CH₄ yr⁻¹ and 0.16 Tg N₂O yr⁻¹ from WWTPs, but rely on IPCC EFs built from sparse data and theory. In situ studies reveal much higher emissions, especially from anaerobically digested sludge storage—assumed zero for N₂O by IPCC yet shown to emit significantly under compost-like conditions.
Drone-Based Measurement Approach
Site Selection & Field Campaigns
Twelve full-scale Swedish WWTPs (42 600–1 000 000 pe) and one regional sludge yard were chosen for diverse influent profiles, nitrogen-removal methods, and storage practices. Two campaigns ran from March–July 2022 and June 2023–April 2024, focusing on high-flux steps and involving local operations managers committed to emission reduction.
Sensor Platforms & Flux Mapping
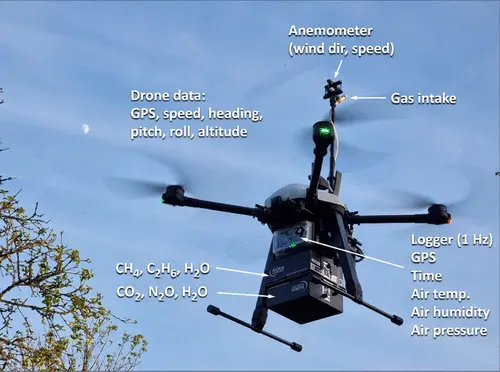
Two integrated unmanned aircraft systems (iUAS) deployed high-frequency gas sensors and meteorological probes:
- iUAS-1 (DJI Matrice 300): Single-gas CH₄ or N₂O sensor, anemometer, T/RH/pressure probes; 30 min flights.
- iUAS-2 (Airolit Explorian XLT): Dual-gas CH₄/C₂H₆ and N₂O/CO₂ sensors with identical ancillary instruments; extended flight time.
Operating at 1–3 m/s between 1–120 m altitude, gas and wind data were sampled at 1 Hz (5 Hz for wind). A mass-balance “virtual wall” compared upwind and downwind transport to compute net fluxes, with delays corrected via breath-test calibration.
Flux Calculations & Emission Factors
Flux Computation
Instantaneous flux densities (g m⁻² s⁻¹) combined gas concentration, perpendicular wind speed, air pressure, and temperature. Vertical “walls” of data were interpolated onto 1 × 1 m grids; net emissions equal downwind minus upwind transport. Monte Carlo perturbations quantified uncertainty as standard deviations.
Emission Factor Tiers
- Tier 1 (IPCC): Based on influent-effluent N loads; assumes zero N₂O from sludge.
- Tier 2 (Swedish EPA): Country-specific factors; likewise excludes sludge-pile N₂O.
Gålfalk M & Bastviken D. 2025. Environmental Science & Technology 59: 18146-18155. DOI: 10.1021/acs.est.5c04780
Results: CH₄ & N₂O Emission Profiles
Plant-Level Emissions
- CH₄: 3.7–471 t yr⁻¹ per plant; 78% emitted from sludge storage.
- N₂O: 1.9–68.3 t yr⁻¹; 47% from sludge storage.
- AD Sludge CO₂e: N₂O emissions equal 8.6 ± 2.5% of sludge CH₄ mass, contributing 46 ± 7% of 100-year CO₂e from piles.
Comparison to Inventories
- Observation-based emissions vs. Tier 1 & 2:
- CH₄: 4.4–6.3× higher
- N₂O: 2.9–3.0× higher
- CO₂e: 3.1–3.4× higher
- Median N₂O/CH₄ mass ratio: 14%; N₂O accounts for 45–95% of total CO₂e (mean 65 ± 18%).
Influence of Temperature & Sludge Age
CH₄ emissions correlate strongly with sludge age rather than air temperatures above 5 °C. Excluding months below 5 °C still yields CH₄ and CO₂e fluxes exceeding Tier 2 factors by 3.3× and 2.4×. In warming climates, high-emission periods will extend, amplifying total GHG output.
Implications for Inventories & Mitigation
Revising Emission Factors
Field data reveal that ignoring sludge-pile N₂O severely underestimates WWTP GHGs. High temporal variability of N₂O—driven by oxygen intrusion, pH, ammonium, and C∕N ratio—mirrors compost dynamics, warranting updated EFs based on real measurements.
Driving Mitigation R&D
High-resolution tools enable hotspot mapping, cost-justified investments, and verification of reduction strategies such as:
- Thermophilic vs. mesophilic digestion
- Ammonia or urea dosing
- Biochar and mineral amendments
Encouraging plant-level voluntary reduction programs and investment in tracer-gas techniques will accelerate progress.
Gålfalk M & Bastviken D. 2025. Environmental Science & Technology 59: 18146-18155. DOI: 10.1021/acs.est.5c04780
Conclusions
Drone-based, full-scale monitoring uncovers that CH₄ and N₂O emissions from WWTPs are 2.9–6.3× higher than current EF predictions, with sludge storage rivaling nitrification/denitrification as a GHG source. Widespread adoption of in situ, high-resolution measurements is essential to refine inventories, drive targeted mitigation, and align climate models with real-world fluxes.
Sources:
- Linköping University. “Unexpected greenhouse gas emissions from wastewater treatment.” Unexpected greenhouse gas emissions from wastewater treatment - Linköping University
- Airolit. “Airolit Drones Reveal Hidden Greenhouse Gas Emissions in New Study.” Airolit Drones Reveal Hidden Greenhouse Gas Emissions in New Study | Airolit
- Gålfalk M. & Bastviken D., In Situ Observations Reveal Underestimated Greenhouse Gas Emissions from Wastewater Treatment with Anaerobic Digestion – Sludge Was a Major Source for Both CH4 and N2O | Environmental Science & Technology